
Turbulence Toward Truth, Slope Toward One: Physics-Based TI Algorithm BA-ATC ,Brings Wind Lidar Measurement Closer to the True Value
In the decision chain of wind farm investment, turbulence intensity (TI) is a parameter that is easily underestimated—yet it runs through everything. Less intuitive than mean wind speed, it quietly shapes turbine selection, load design, and revenue forecasting. And when we measure it with wind lidar, a systematic bias—rooted in the physics of measurement itself—lurks inside the data.
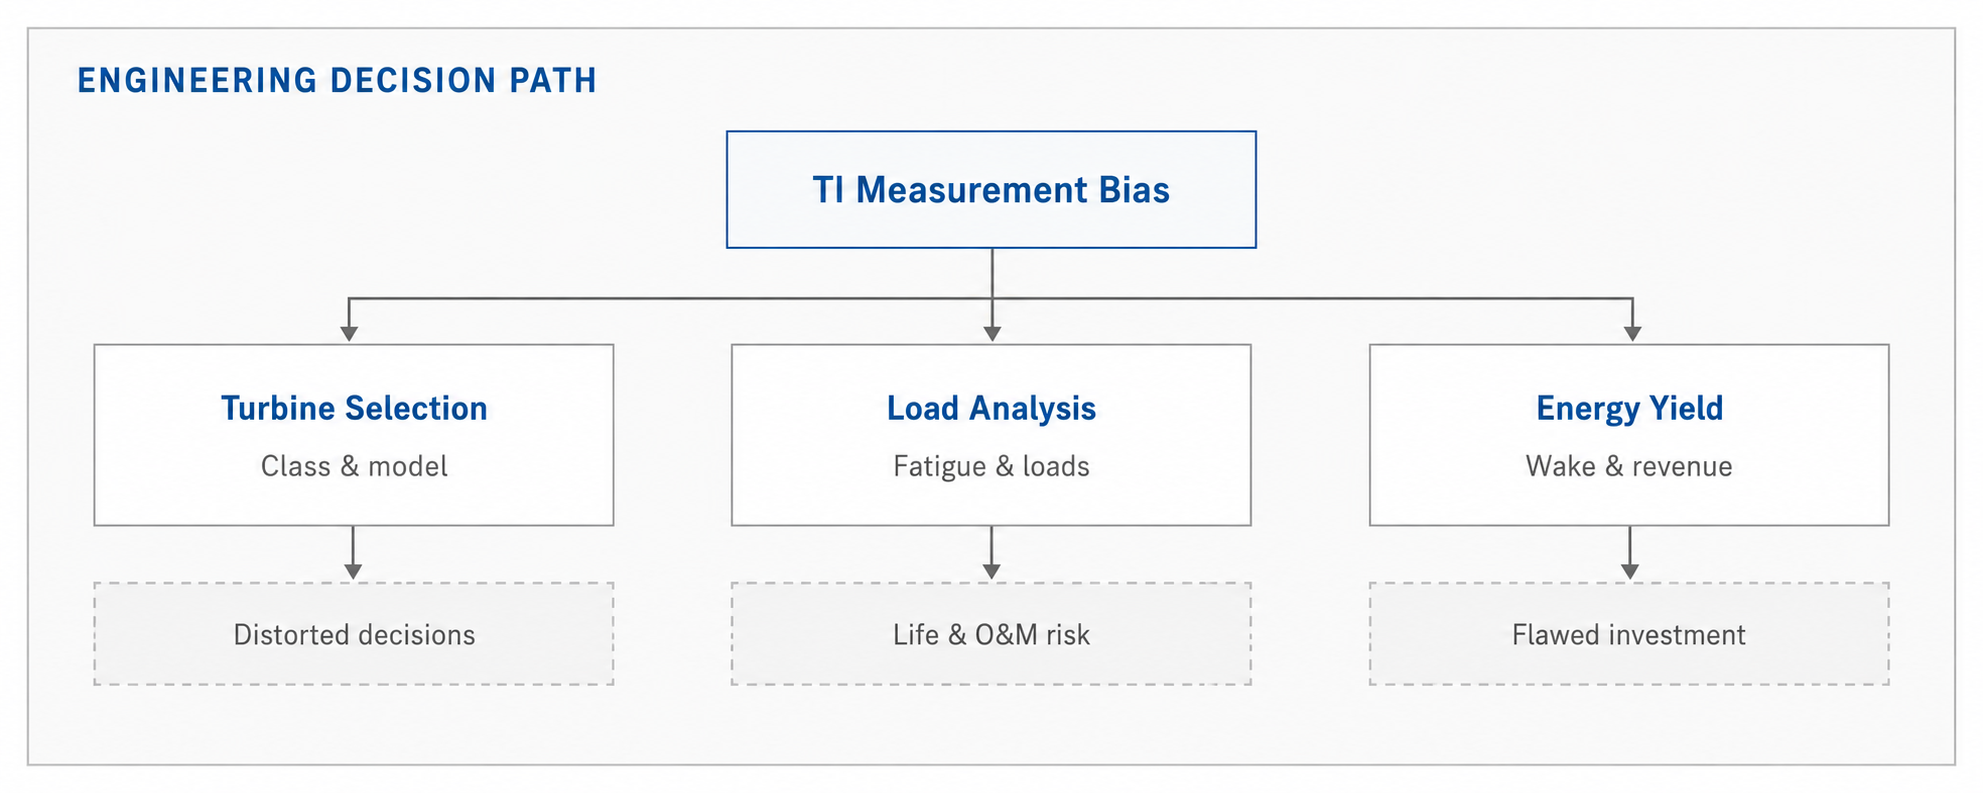
Figure: TI Measurement Bias Decision Chain
The Hidden Pain of Offshore Wind Measurement: The Wind Fluctuates—and So Does the Data
Wind speed measurement is a mature discipline. Wind lidar can profile wind speeds at heights of 10–300 meters, is flexible to deploy, and costs far less than a met mast. It has become an important tool for onshore wind resource assessment, and the same advantages apply even more strongly offshore, where met mast construction costs are prohibitive.
But wind speed is only half the story. The wind's true character hides in its "gustiness"—turbulence intensity (TI), which describes how much the wind speed fluctuates around its mean. At the same mean wind speed, one site may be smooth while another is violently turbulent. For a wind turbine, the latter means higher fatigue loads, shorter mechanical life, and potentially a higher IEC class requirement.
The problem: lidar measures mean wind speed accurately—but TI less so. This is not a defect of any particular device; it is determined by the scanning principle itself. In general, lidar-measured TI carries a bias of roughly 5%–20%, with considerable uncertainty.
A 15% overestimation of TI is enough to skew the IEC turbine class assessment. In a large wind project, the cost difference implied by such a bias is substantial. More critically, it can make load analysis overly conservative and distort energy yield predictions. At worst, it may even trigger contractual disputes during operational wind condition verification.
What Is Turbulence Correction: Bringing "Measured" Back Toward the Reference
As the name suggests, turbulence correction brings the TI measured by wind lidar closer to the industry gold standard—the cup anemometer on a met mast.
To understand why this is necessary, we first need to understand how the two measurement approaches differ.
A cup anemometer on a met mast measures wind fluctuation at a single point: as the wind gusts, it spins. Lidar works differently—it scans a cone through the air with 4–5 laser beams and synthesizes the horizontal wind speed. At 100 meters, the scan circle is roughly 100–120 meters in diameter, depending on device elevation angle. This difference in measurement principle is exactly where the TI bias comes from: what the lidar “sees” is not the wind at one point, but a kind of “average” across a large volume of space. The conical scan blends spatial variation and temporal asynchrony into the wind speed series, causing TI to systematically deviate from cup anemometer readings.
Turbulence correction builds a mathematical model from the measurement physics to reverse the effects of these two filters, restoring wind speed fluctuations closer to what a cup anemometer would capture.
Blue Aspirations’ BA-ATC (Analytical Turbulence Correction) is precisely such a physics-based lidar TI correction product.
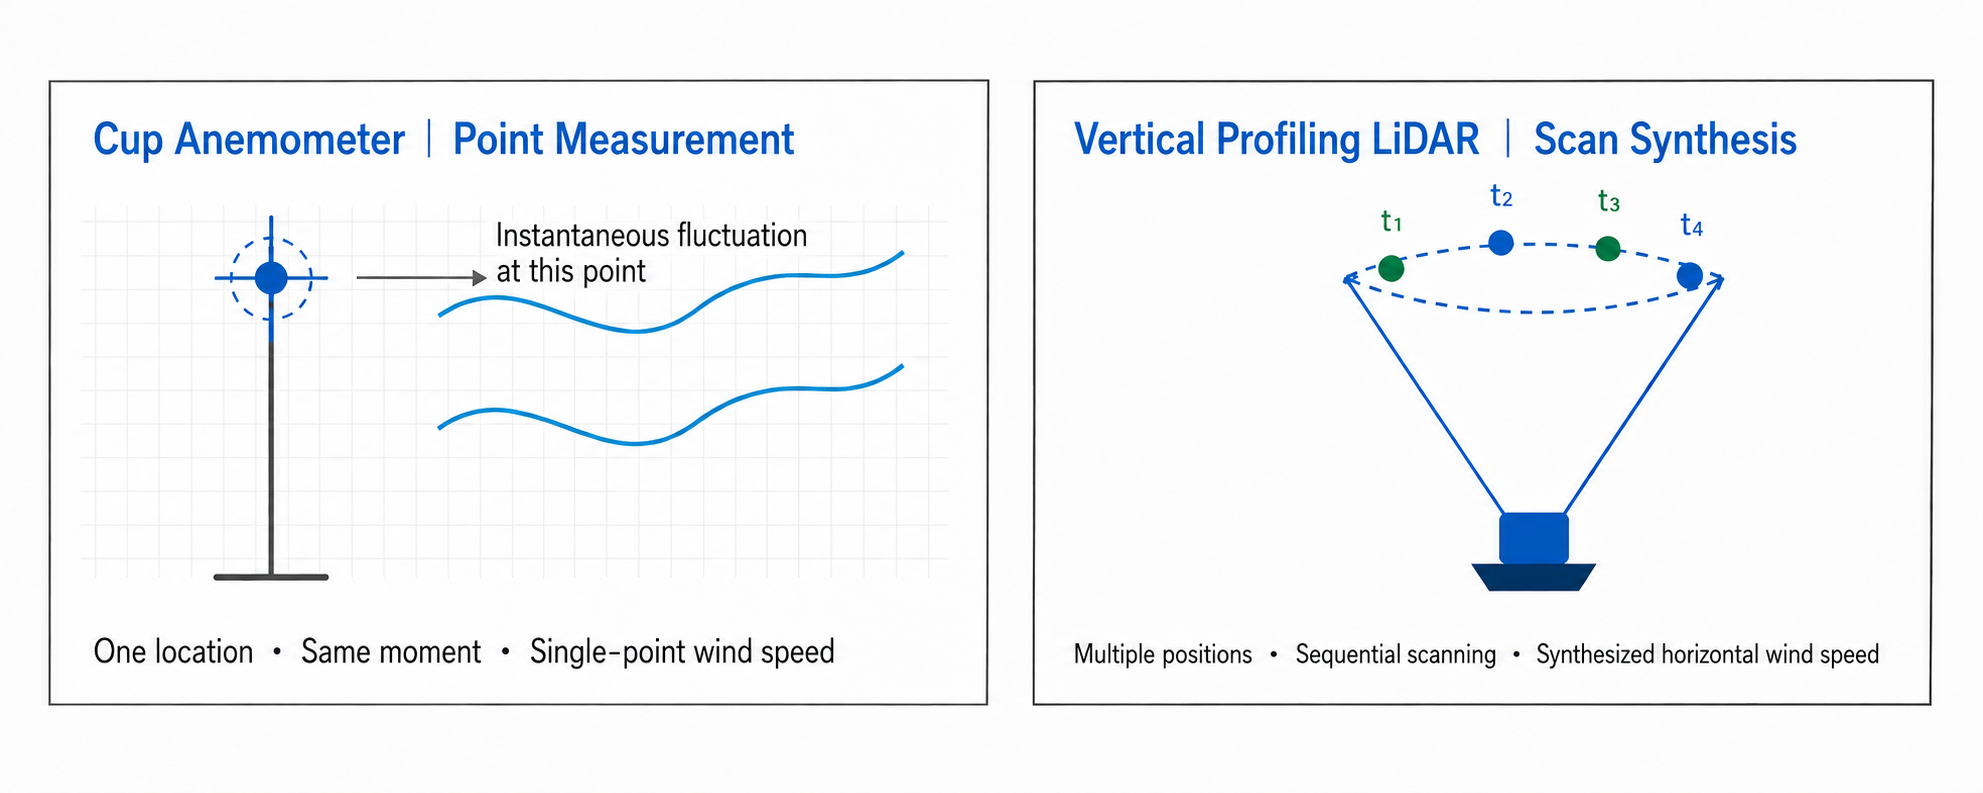
Figure: Met mast cup anemometer (left) and wind lidar (right)
Before and After: From "Clearly Biased" to "Nearly on the 1:1 Line"
Data is the most persuasive language of technology.
BA-ATC was evaluated at seven heights from 40 to 160 meters, comparing a Molas B300 lidar against a met-mast cup anemometer using concurrent 10-minute data.
The following table shows the changes in TI relative deviation before and after correction.
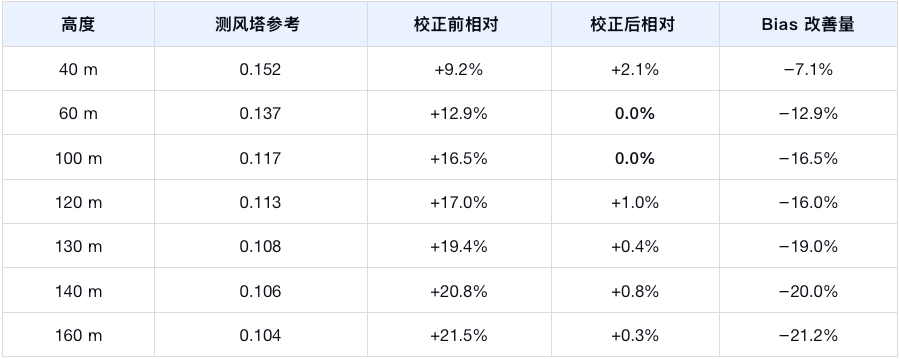
Before correction, the relative TI bias climbed from 9.2% all the way to 21.5%, growing with height. After correction, the bias at every height converged to within 0.0%–2.1%, with a mean close to zero.
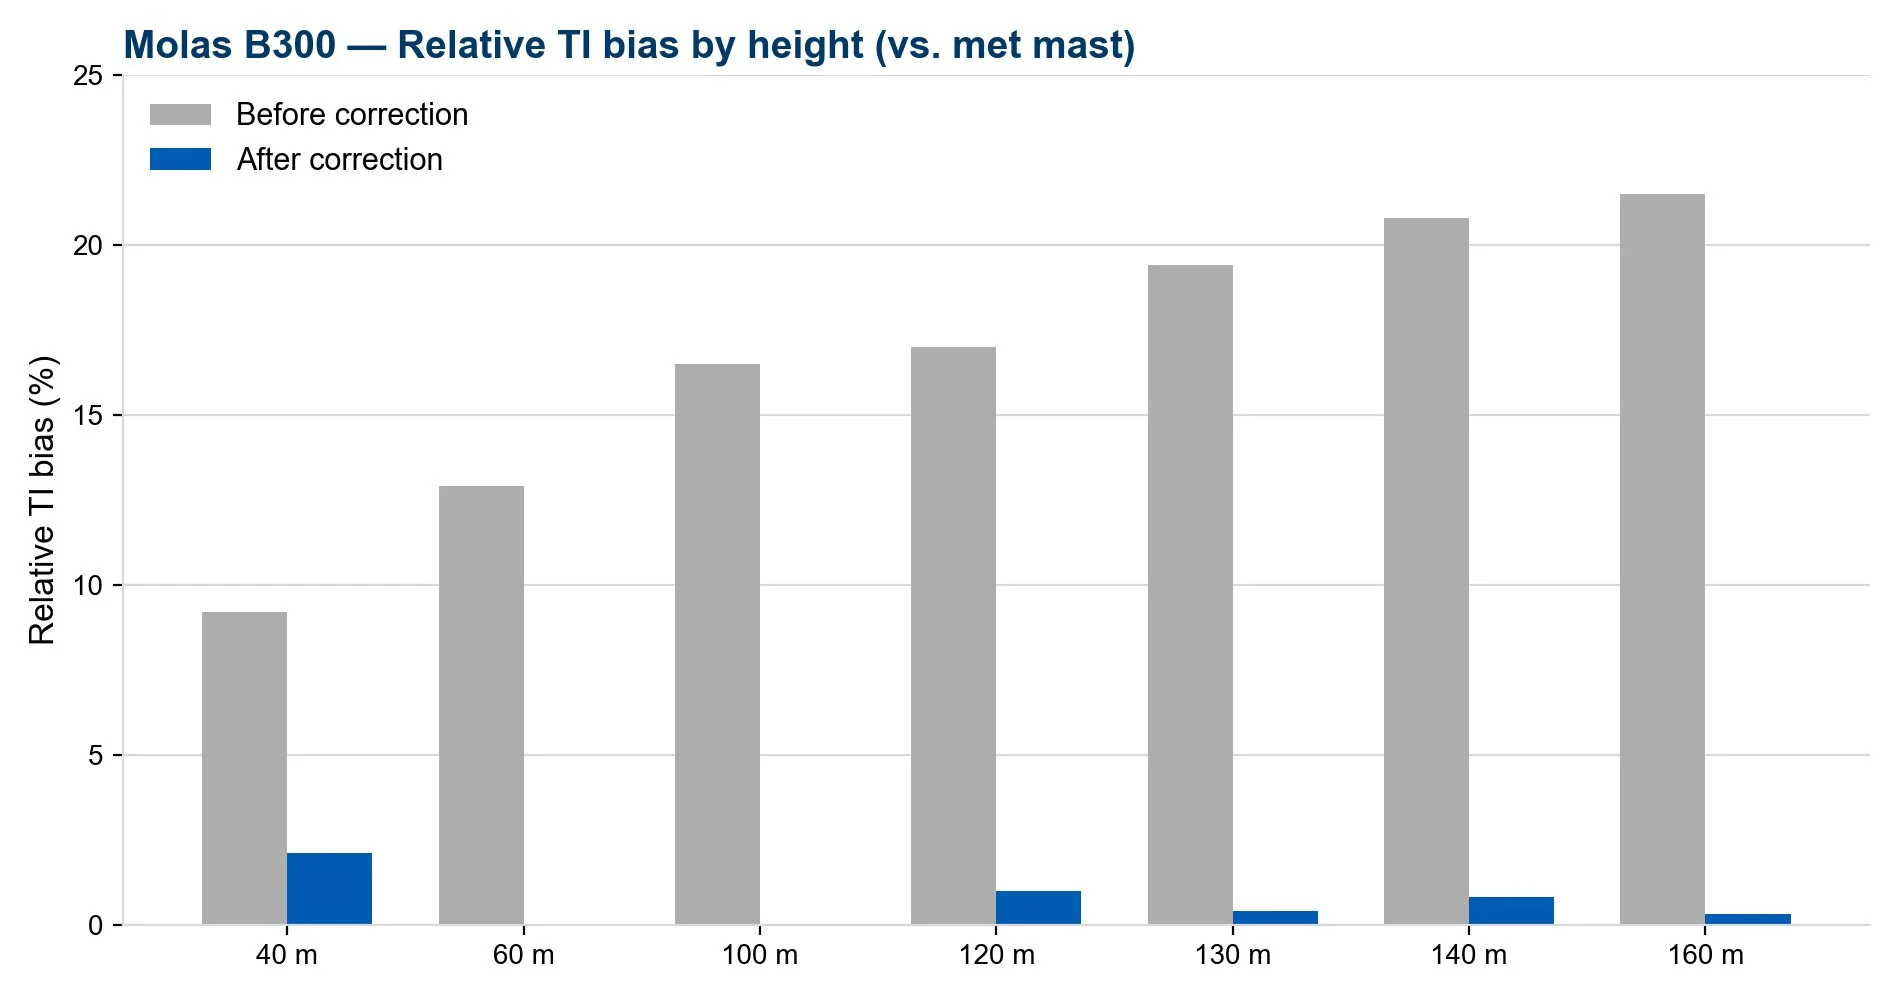
Figure: Relative TI deviation of Molas B300 at seven heights (40–160 m): pre-correction (grey) increases with height; post-correction (blue) converges to 0%–2% at all heights.
Another key metric is the regression slope k (fit equation y = kx, through the origin). A k of 1.0 means the lidar TI agrees perfectly with the mast TI.
Before correction, k ranged from 1.089 to 1.226—meaning the lidar systematically overestimated TI by roughly 10%–23%.
After correction, all k values converged to 0.980–1.007: the systematic bias was effectively removed.
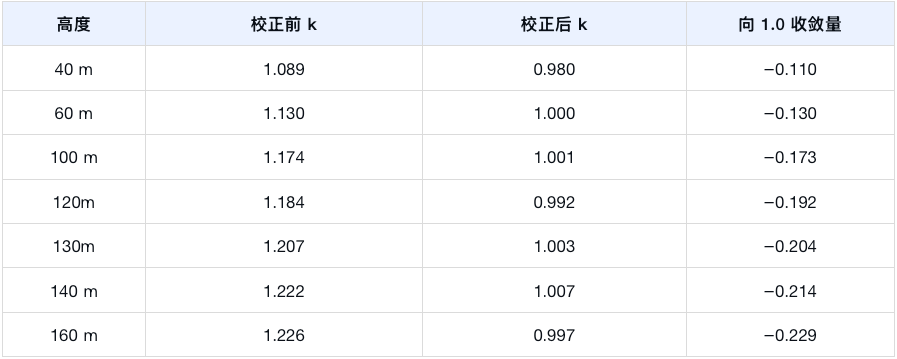
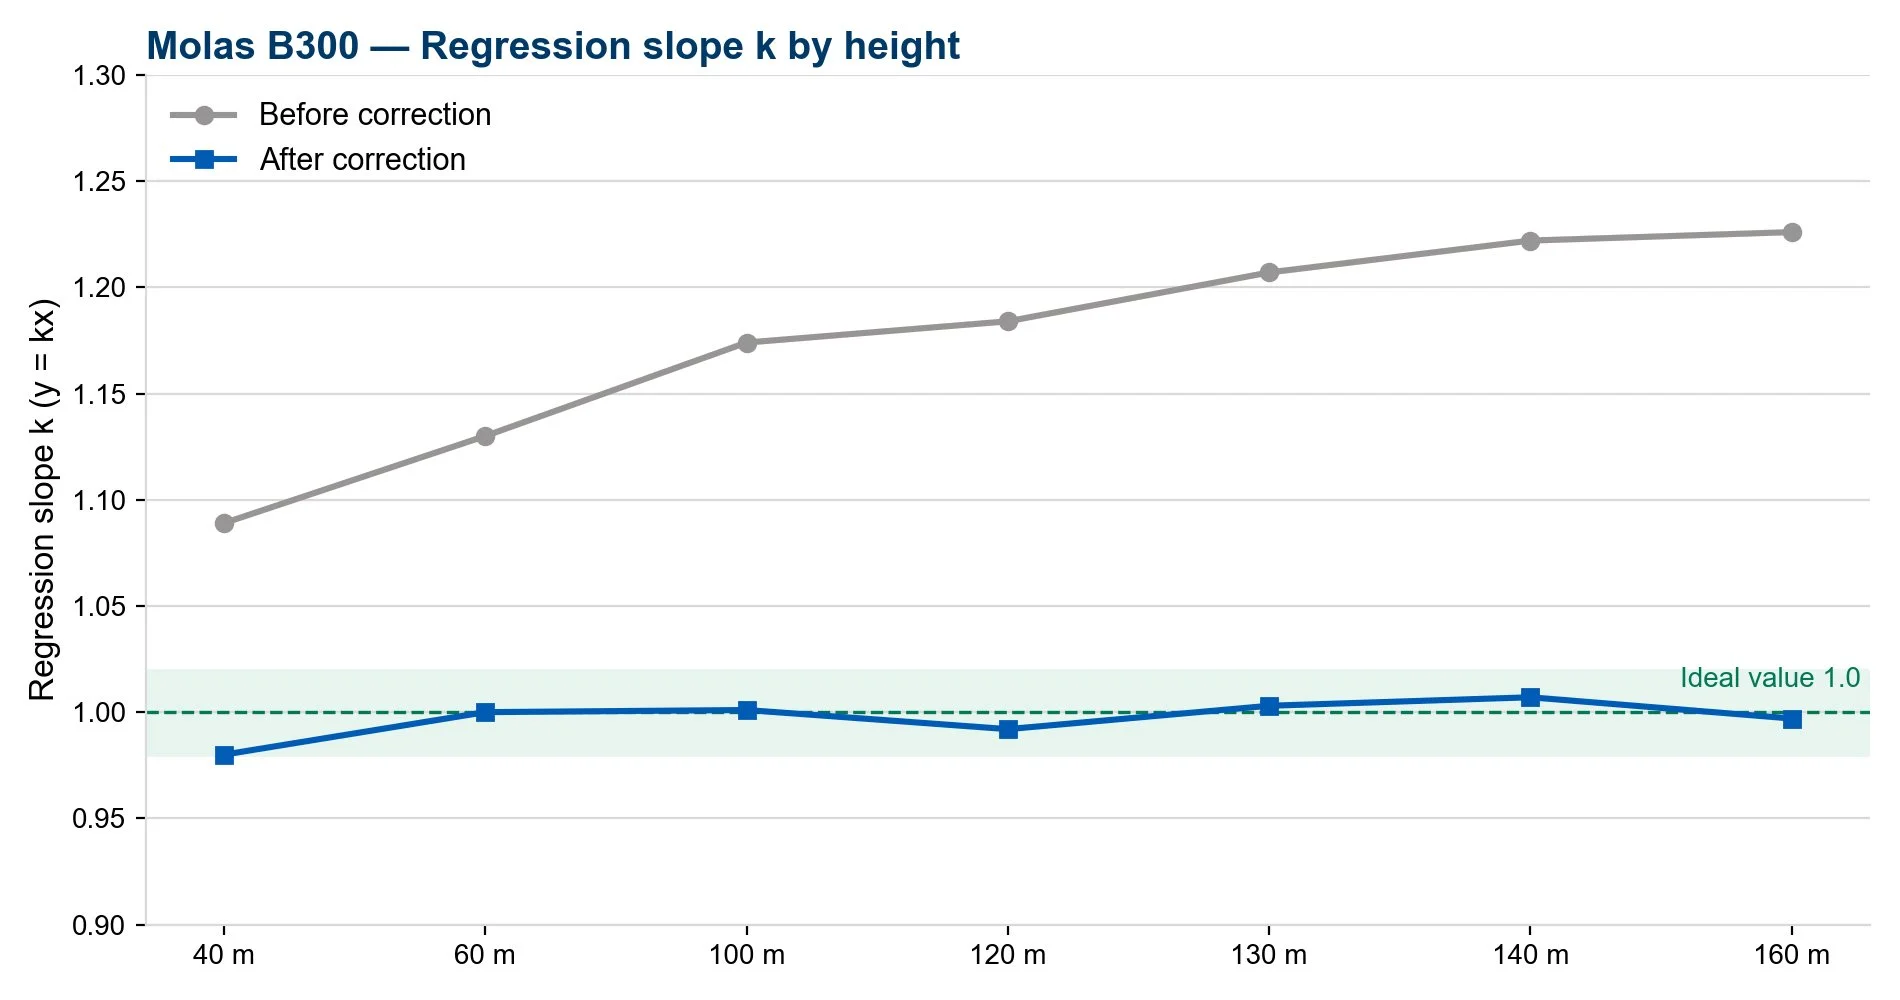
Figure: Molas B300 TI regression slope k (y = kx, through origin) at each height: pre-correction k is systematically greater than 1.0 and increases with height (grey); post-correction converges to near 1.0 at all heights (blue).
Technical Principle: Physics modeling, Not Data Fitting
The core methodology of BA-ATC can be summed up in one sentence: not data fitting, but physics modeling.
The problem with data fitting is that it depends on historical data from a specific site and a specific device—change the wind farm or the lidar, and the model may no longer apply. BA-ATC instead starts from the measurement physics of wind lidar, building separate analytical models for the spatial volume-averaging effect and the asynchronous-sampling effect. By restoring the wind fluctuation components that are "lost" or "introduced" during scanning, it outputs a 10-minute TI closer to that of a cup anemometer.
This design also brings several important product characteristics:
Wind speed and direction untouched: only TI is corrected; mean wind speed and direction are preserved exactly, leaving the body of the customer's measurement data unaffected.
No training on customer data: customer data is used only for the processing task at hand—never for algorithm training or retraining.
Traceable and auditable: every record carries its correction status and processing rationale, with complete version records of the algorithm, parsers, and rules.
Transparent and open: correction performance is disclosed per height and per wind-speed bin—no single "overall metric" is used to mask local limitations.
As a result, BA-ATC's correction capability depends only on the algorithm version—not on project data. A new device or a new site requires no re-tuning.

Figure: BA-ATC Processing Chain
Applications and Customer Value: Making Accurate TI a Project "Stabilizer"
For different roles, its value has different emphases:
Wind measurement service providers: higher-quality delivered data, stronger bids and client trust, and less risk of being challenged by customer later.
Turbine OEMs: reliable TI to support load analysis and model recommendations, reducing design risk caused by inaccurate field data.
Wind farm owners and developers: fewer selection misjudgments and investment-return deviations caused by TI bias—resource assessment and operational verification become evidence-based.
Design institutes and assessment agencies: standardize inconsistent raw lidar TI data into clean, trustworthy input for downstream analysis.
Lidar manufacturers: close the TI accuracy gap through OEM partnership—without heavy in-house R&D investment.
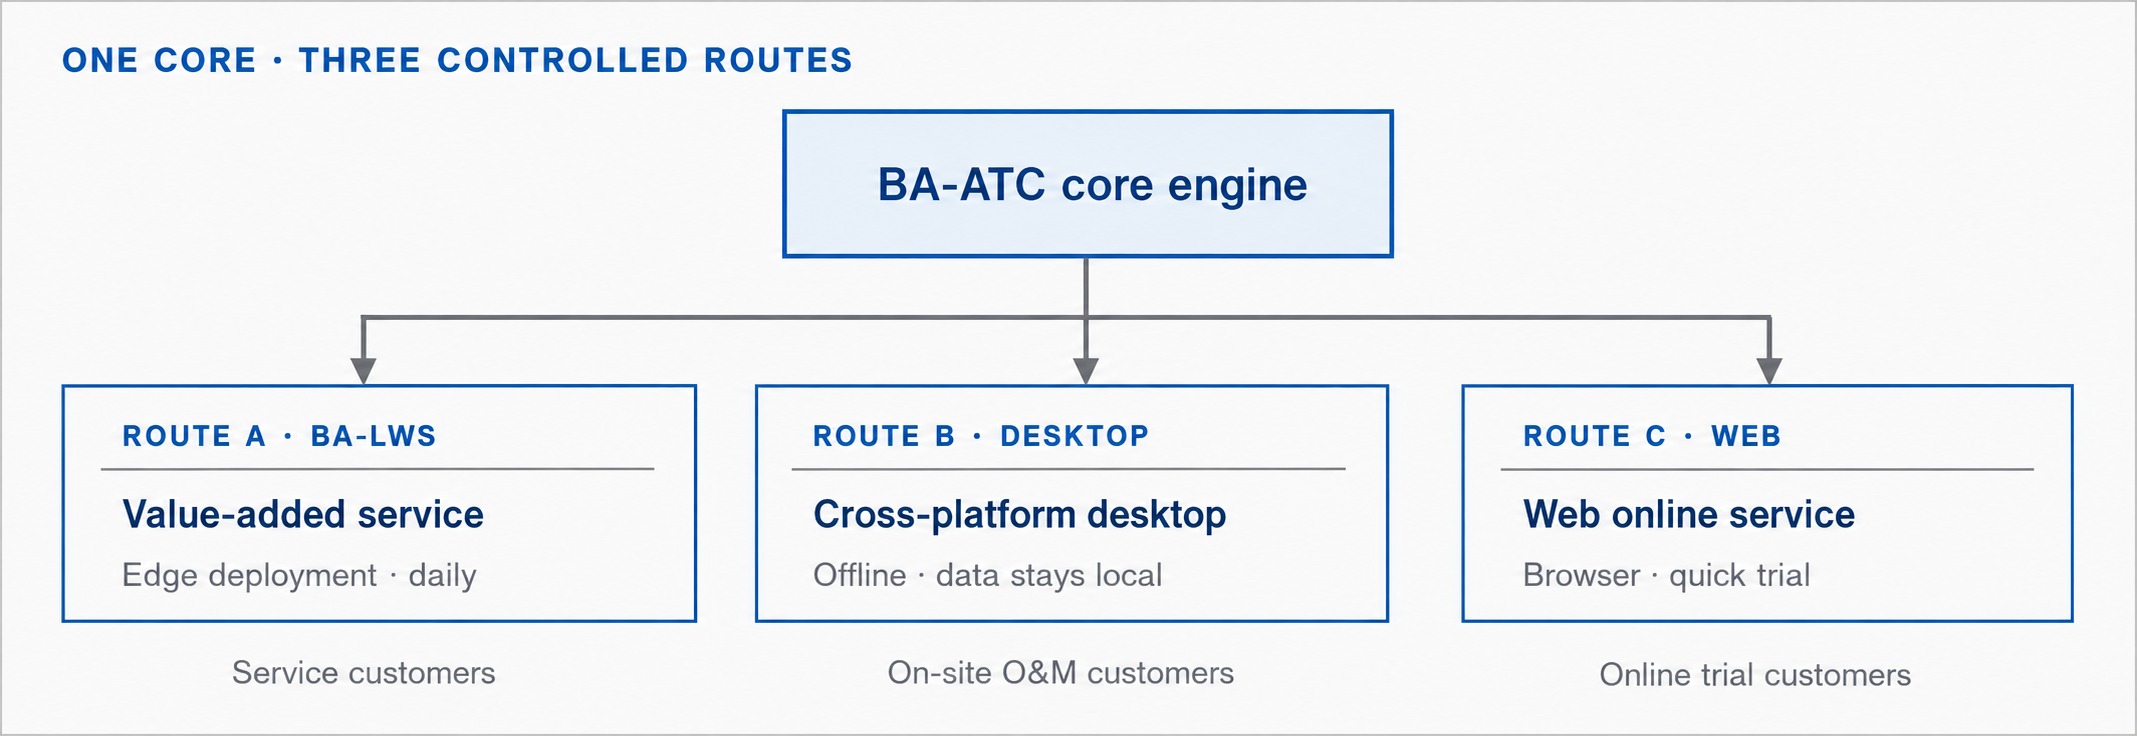
BA-ATC is delivered through three channels: as a built-in value-added module of the BA-LWS wind measurement service; as cross-platform desktop software supporting WindCube and Molas B300 (fully offline—data never leaves your domain); and as a web-based online service, coming soon.
Closing
Turbulence intensity is never a negligible decimal in a wind measurement report. It connects turbine selection, loads, energy yield, and investment returns—an invisible thread running through the entire lifecycle of a wind project.
Lidar has made wind measurement more flexible, higher-reaching, and more economical. BA-ATC makes lidar TI data trustworthy and usable.
Turbulence Toward Truth, Slope Toward One.
Behind these words lies respect for the physics of measurement—and responsibility for every wind investment decision.
The wind will change. The bottom line of data should not.