
Our Stage2 Type Verification FLS Performed Excellently under Storm Babet
Blue Aspirations has deployed a floating LiDAR system in the offshore area of Dundee, Scotland, which is close to the eye of the Strom Babet.
It was an intense extratropical cyclone in Europe, affecting parts of northern and western Europe. The UK Met Office issued a severe red weather warning for Storm Babet.
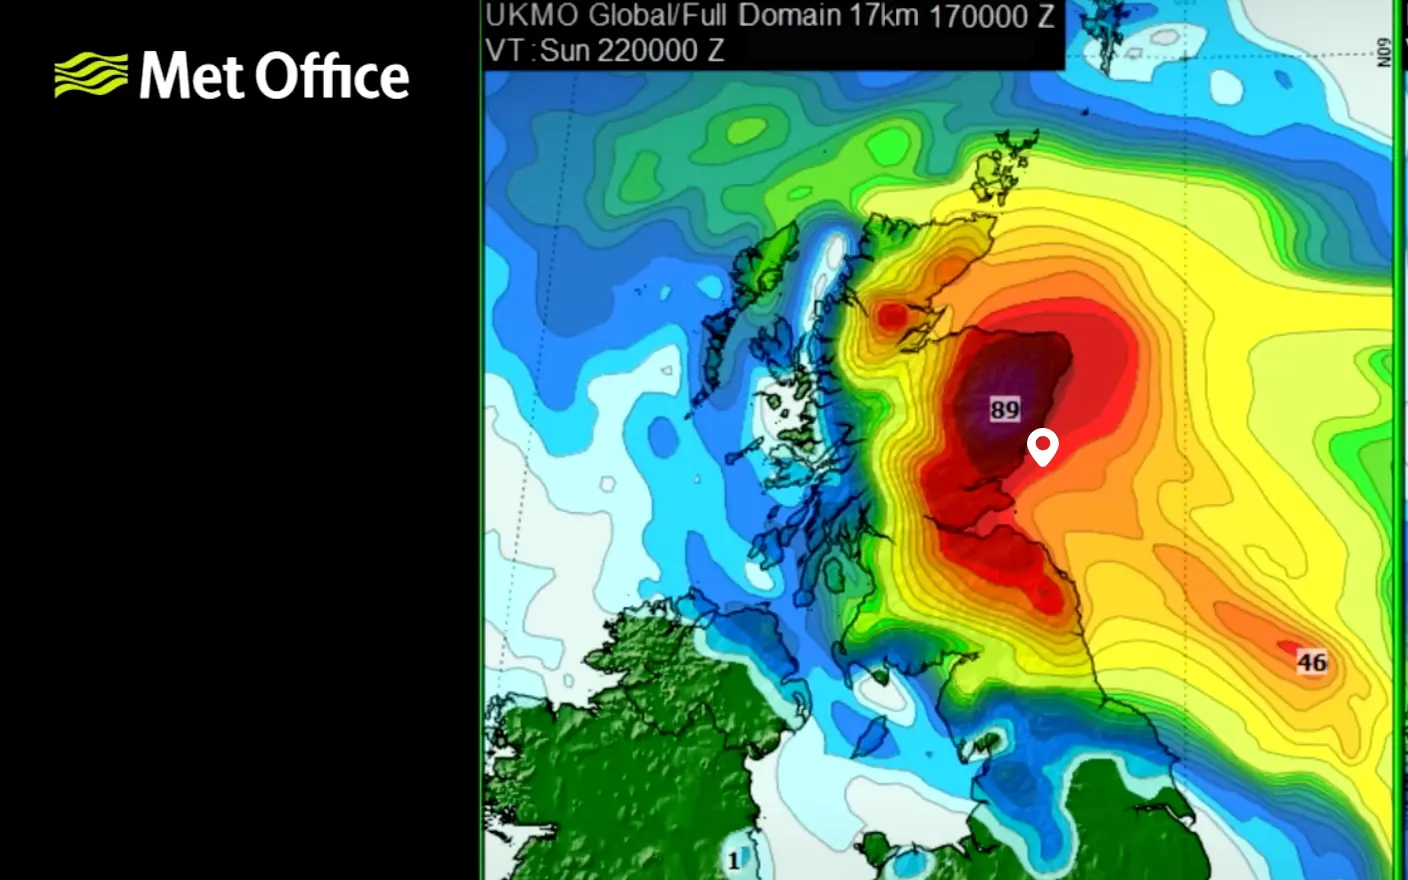
Figure 1: Storm Babet
The latest data from the floating LiDAR shows that the equipment maintains 100% system availability with two concurrent running LiDARs. Meanwhile, the system's voltage remains stable, exceeding 25 V, and all modules are in good health condition.
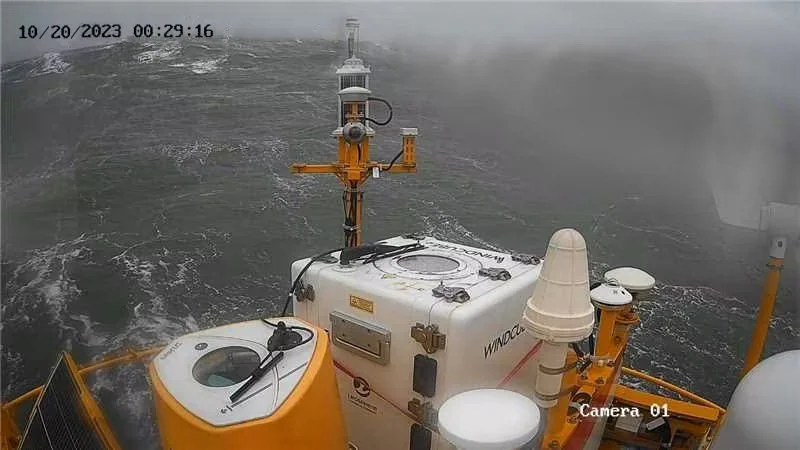
Figure 2: The monitoring record of the floating LiDAR during the storm
Figures 3 and 4 show the data availability of two LiDARs on the floating LiDAR platform. One of the LiDARs is ZX, which maintains 100% data availability between altitudes of 36m to 111m. The other LiDAR is Windcube, which holds a data availability of 99.59% and 99.18% at 250m and 300m altitudes, respectively while maintaining full data availability at all other heights.
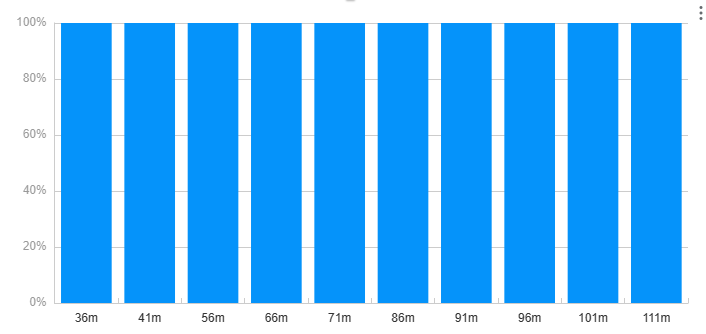
Figure 3: The Data availability of ZX (During the storm)
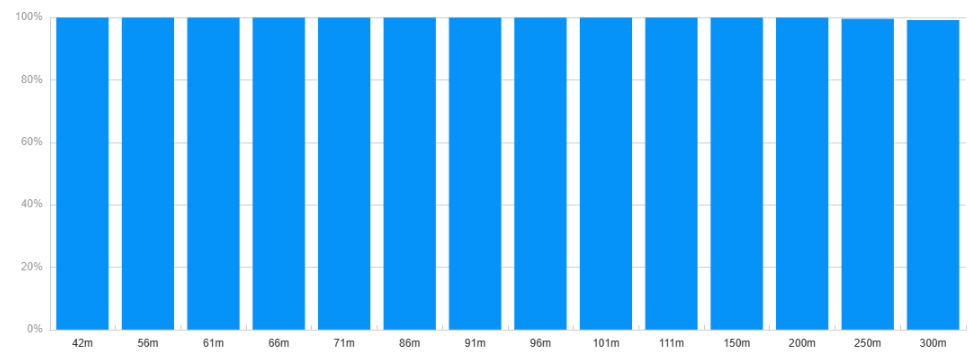
Figure 4: The Data availability of Windcube LiDAR (During the storm)
During the storm, the floating LiDAR finds out that the maximum 10-min average wind speeds at 111m and 300m are 28.1 m/s (by ZX) and 32.11m/s (by Windcube). Figures 5 and 6 show the slope of wind speed over 10-minute periods at different heights with ZX or Windcube.
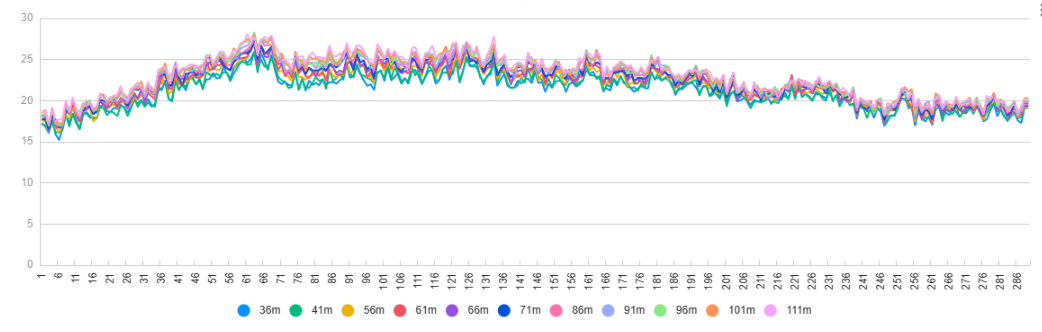
Figure 5: The slope of wind speed over 10-minute periods at different heights by ZX
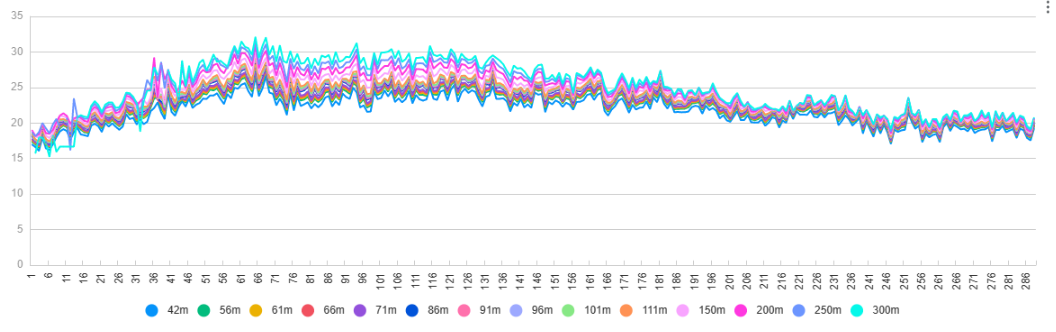
Figure 6: The slope of wind speed over 10-minute periods at different heights by Windcube
Figure 7 illustrates that during the initial stage of the storm, the air pressure has decreased. Subsequently, the air pressure sharply increases while the storm dissipates.
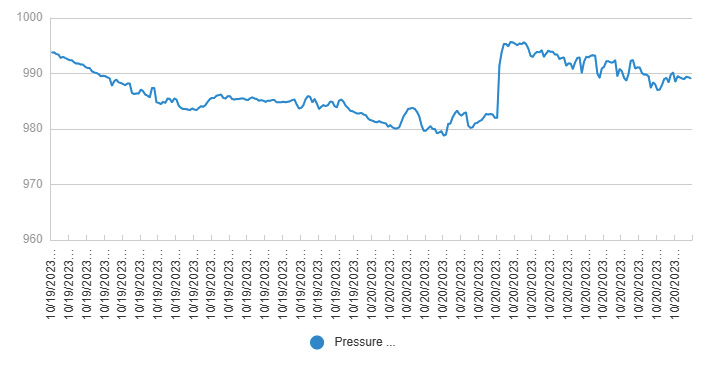
Figure 7: The air pressure in time series
The storm causes terrible waves and the maximum wave height reaches 10.68m. Figure 8 shows the slope of wave heights in a time series.
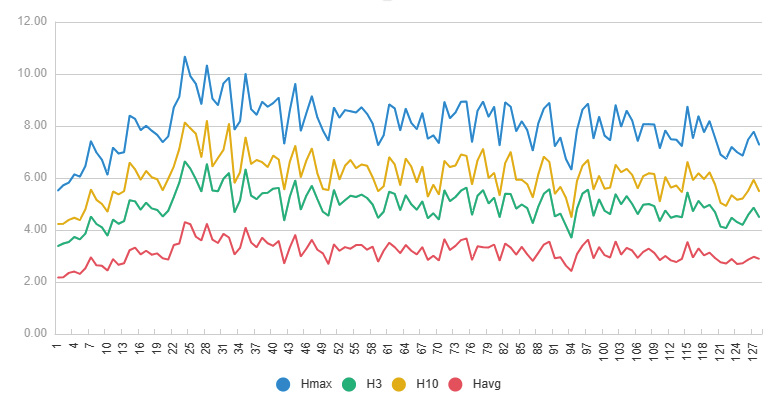
Figure 8: The wave height during the storm in time series
During this period, the system's voltage is much larger than the 23.5V, which is the system's minimum requirement.
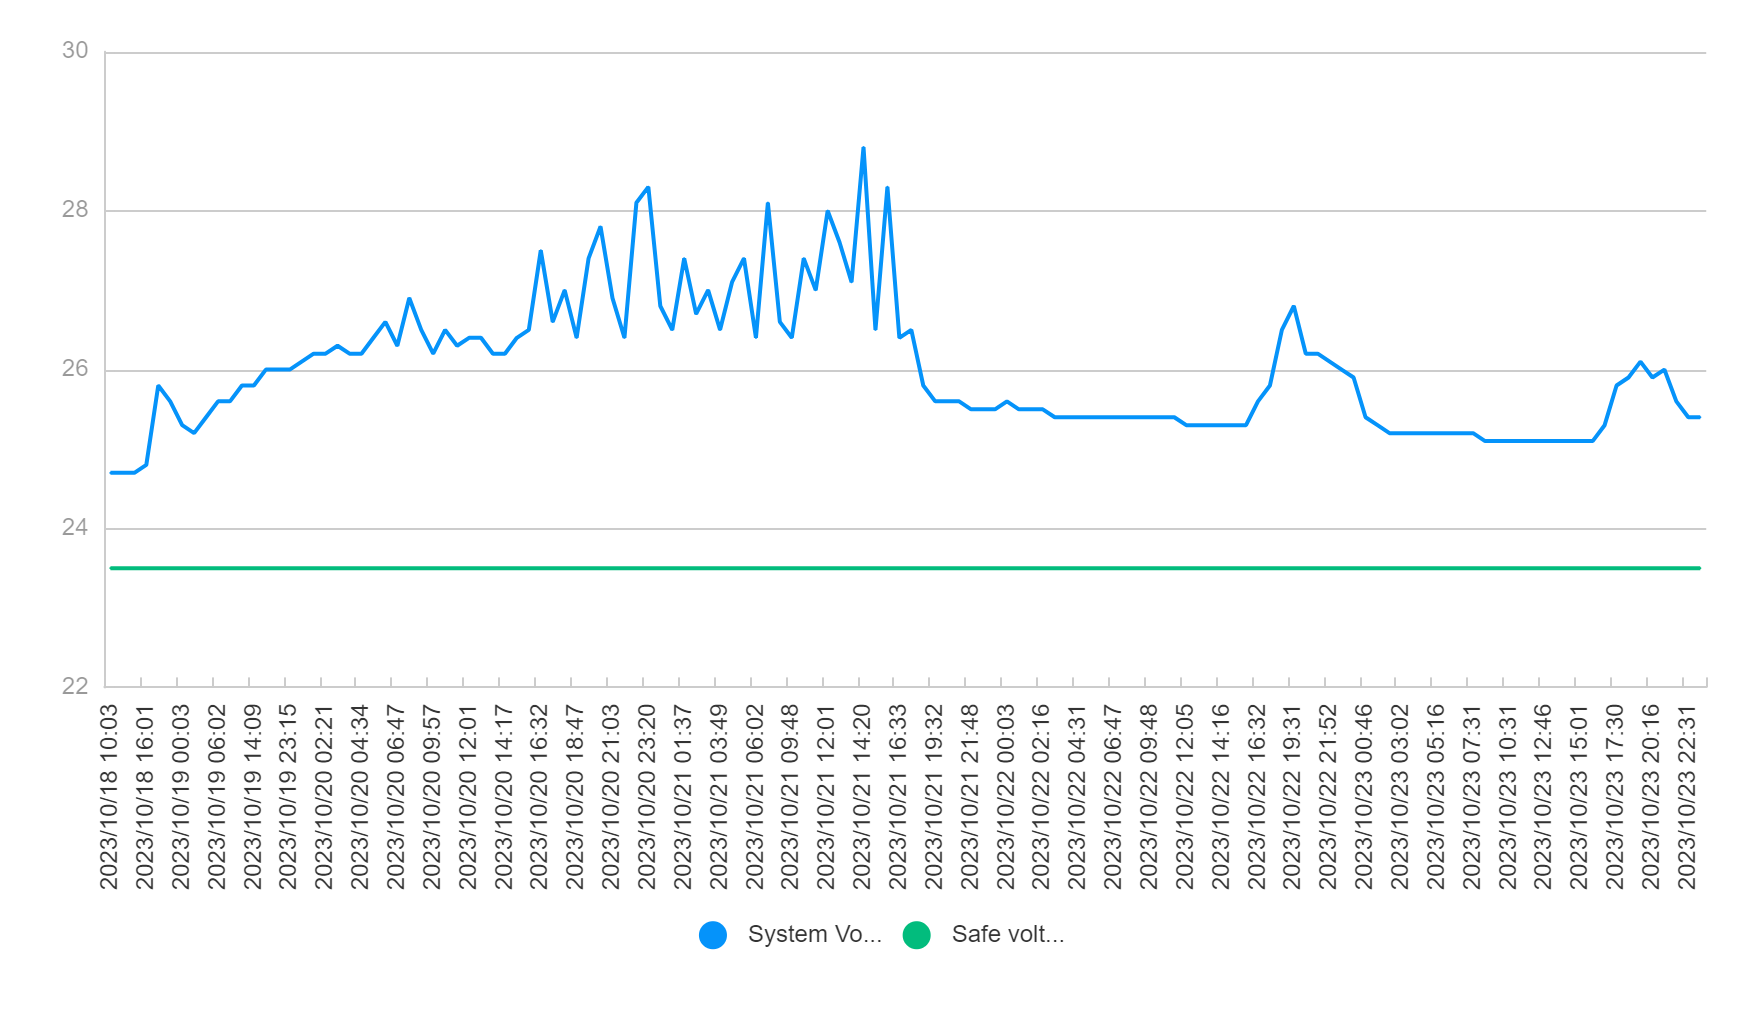
Figure 9: The voltage of the system in time series
The efficiency of electricity generation from solar panels and wind turbines is shown in Figure 10. During this period, wind turbines generate more energy while almost zero power is generated from solar panels.
After the storm, the energy supply from wind turbines and solar panels will be the same as usual. In the storm period, the power consumption of the floating LiDAR system remained around 260W. The power supply system has proven robust and performed excellently during the storm.
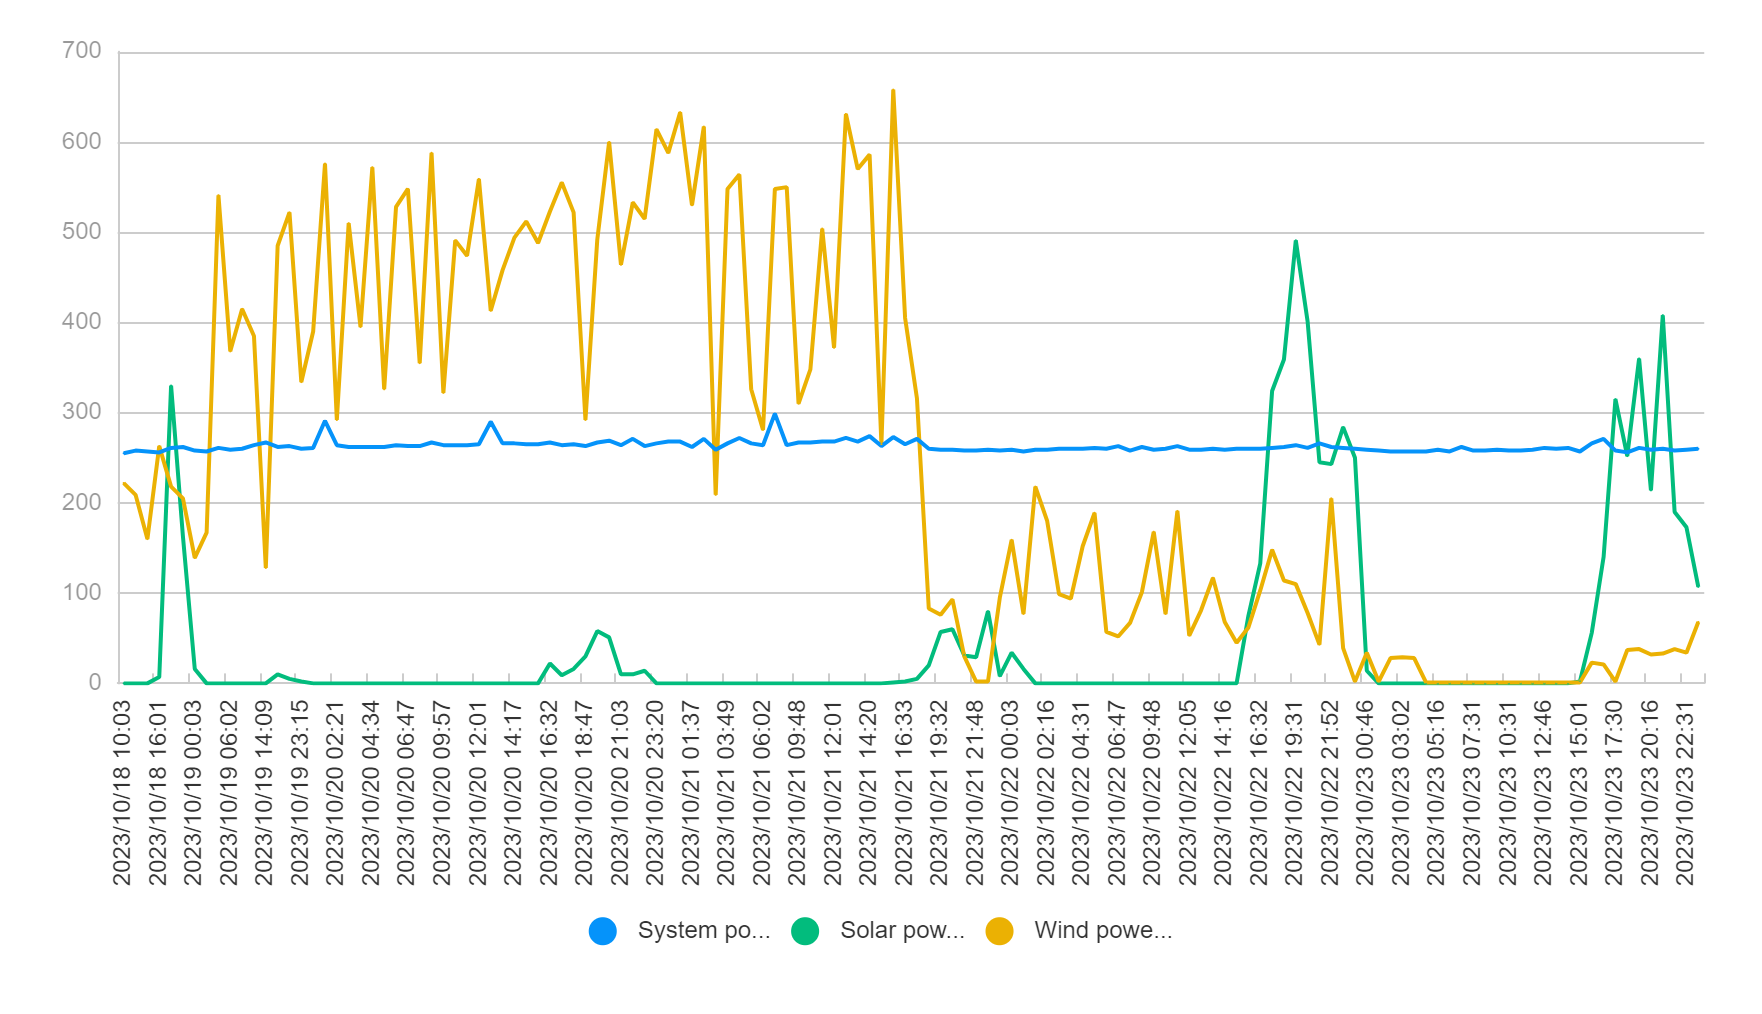
Figure 10: Energy generation from solar panels and wind turbines and power dissipation of the platform
Figure 11 shows the displacement of the floating LiDAR system during the storm. The maximum displacement of the system remains within the safe range, which verifies the stability of the mooring system design.
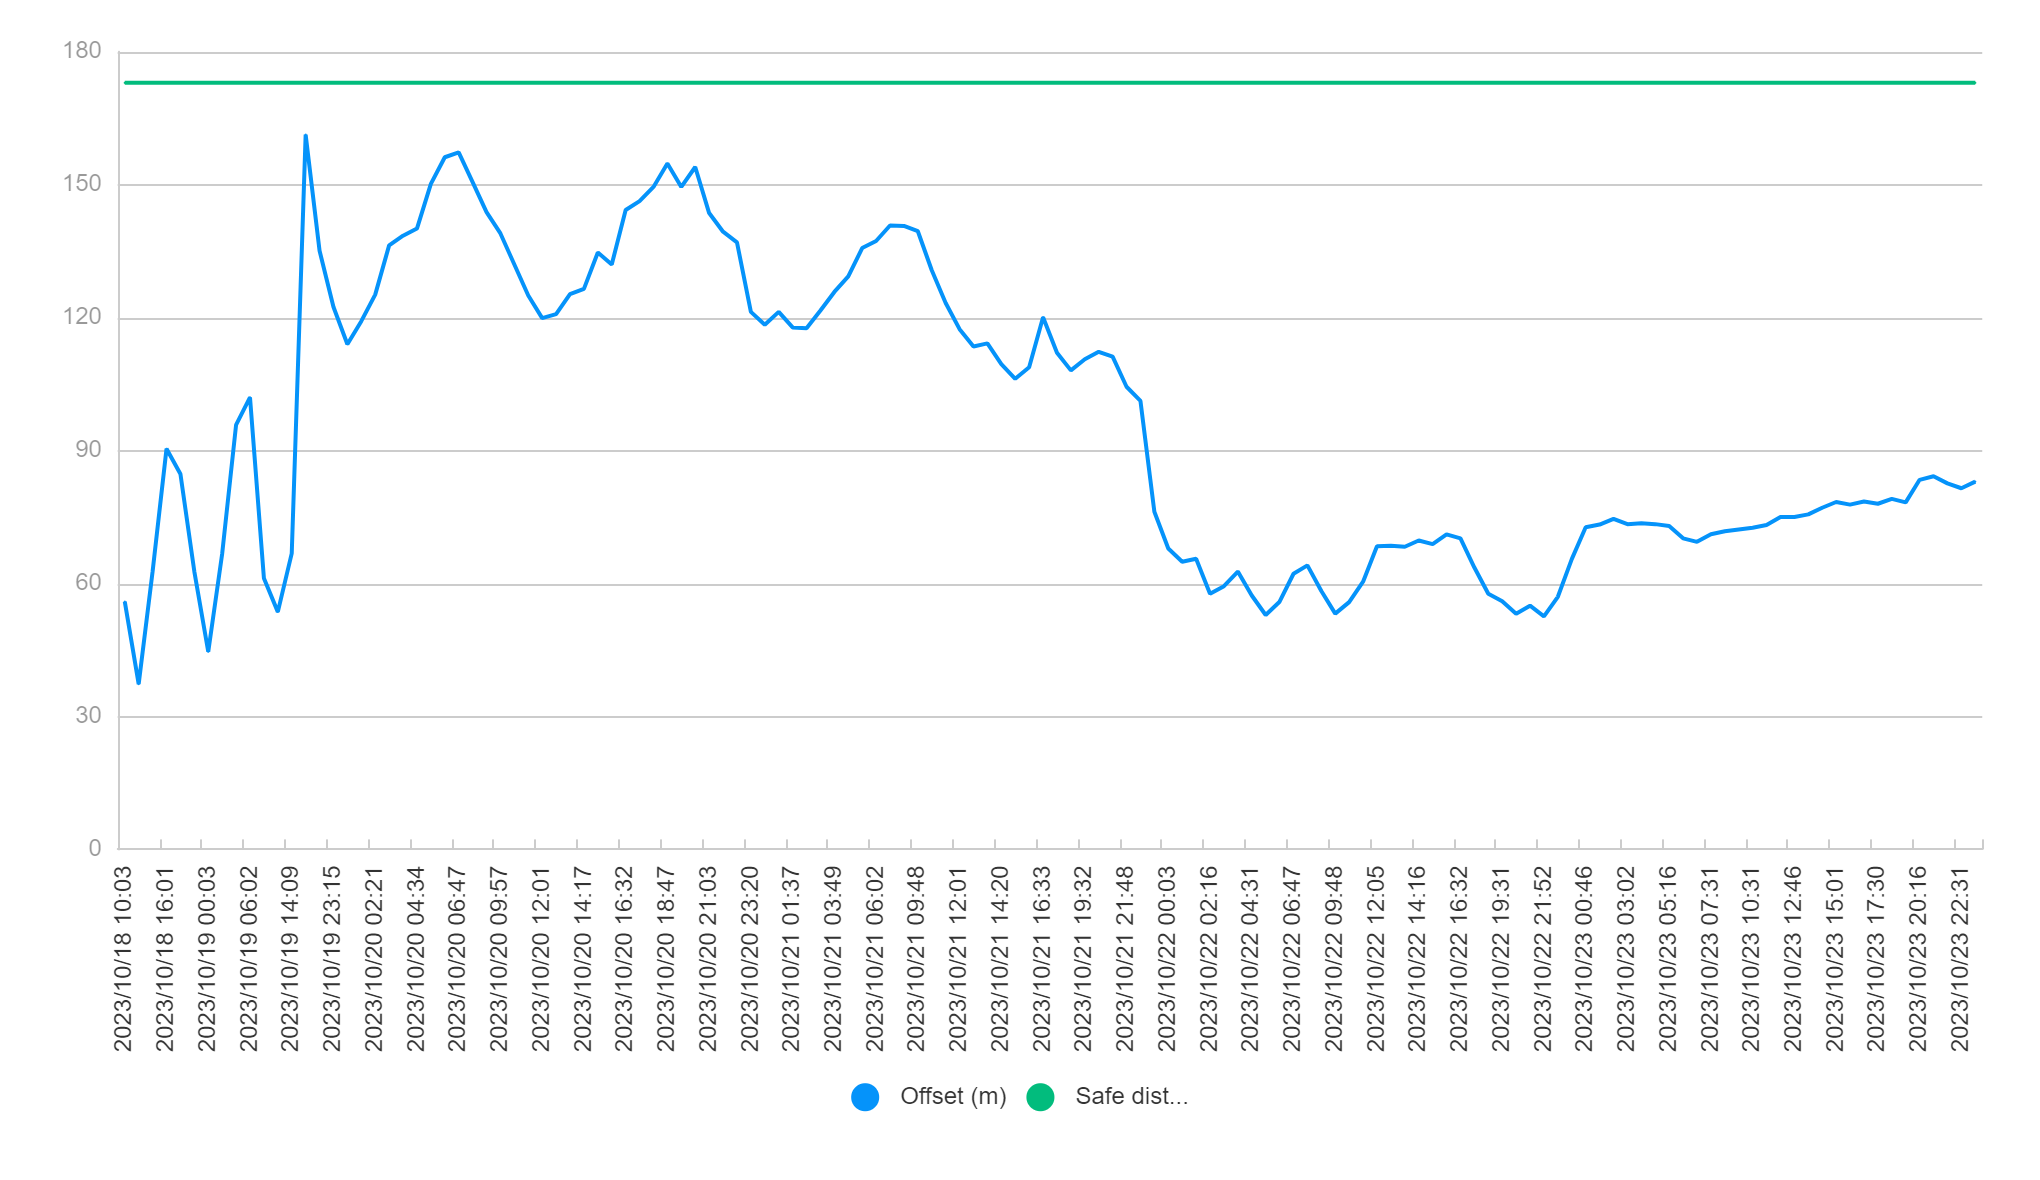
Figure 11: The distance between the platform and project location in time series
Table 1 is the statistical data of the system's motion during the storm. For more than 97.7% of the period, the pitch and roll of the system are less than 15 degrees, which proves the stability of the design.
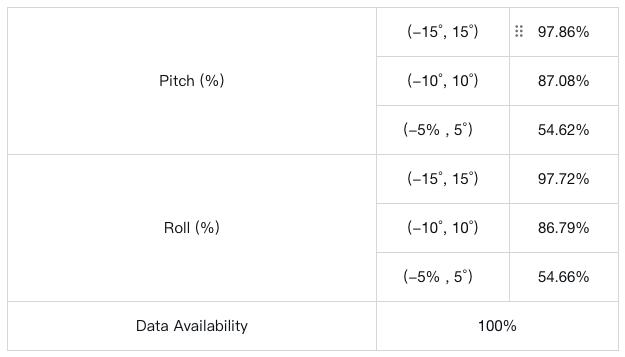
Table 1: Statistical of pitch and roll
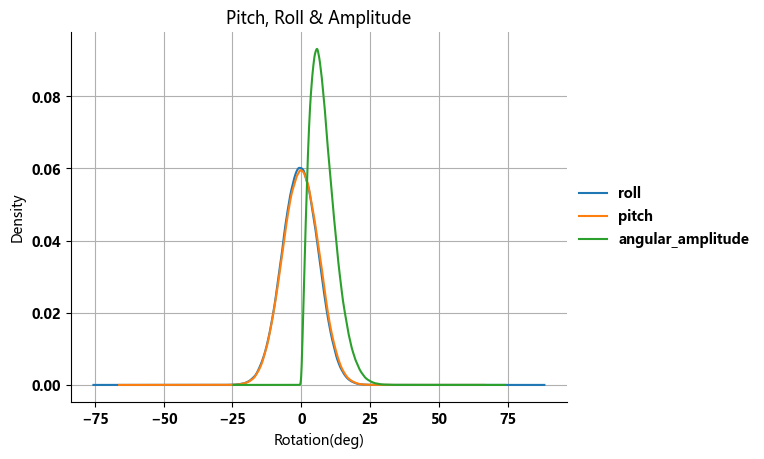
Figure 12: Distribution of roll, pitch, and angular amplitude in the period
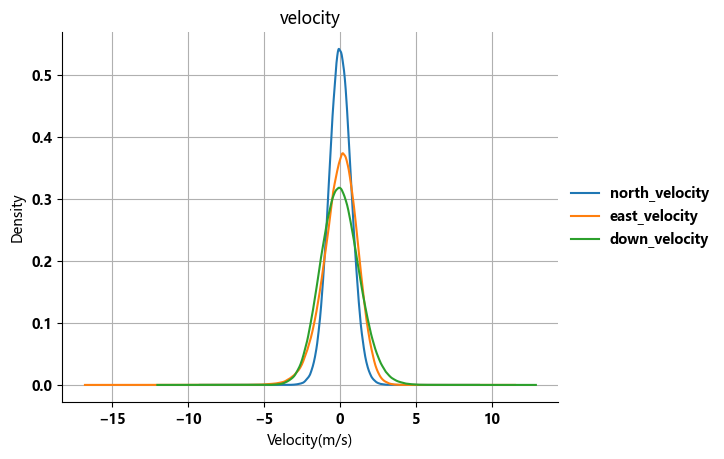
Figure 13: Distribution of velocity in the period
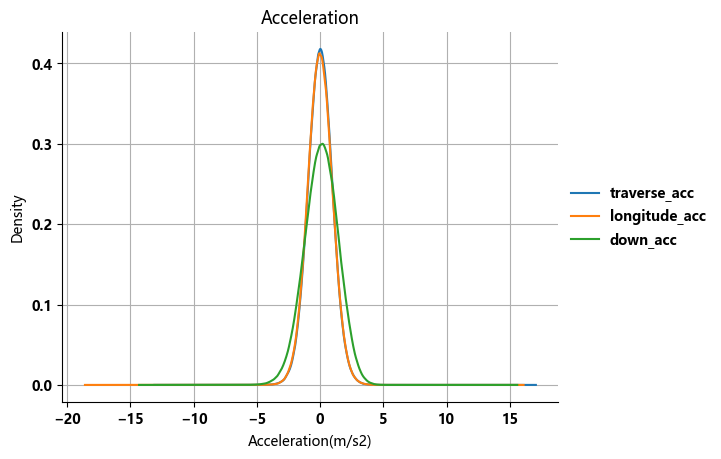
Figure 14:Distribution of acceleration in the period
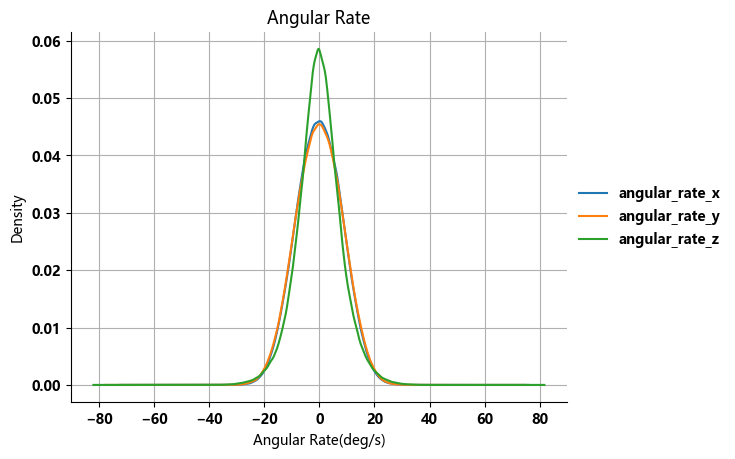
Figure 15: Distribution of angular rate in the period
Blue Aspirations completed the OWA Stage 2 verification on September 10th and also passed the challenge by the storm Babet. The power supply system, data communication system, buoy system, mooring system, and redundancy design are proven to have high robustness levels. Blue Aspirations will keep the continuous improvement mindset and provide sustainable solutions to the global offshore wind industry.