
Analyze Product Requirements through People, Objects, Time, and Space
In the fast-paced world of product development, teams often focus narrowly on features, user interfaces, or immediate market needs. While these elements are important, they frequently overlook the broader context in which a product lives. This narrow focus leads to missed requirements, unforeseen risks, and brittle lifecycles. A more robust approach is to analyze the product by deconstructing its ecosystem into four fundamental dimensions: People, Objects, Time, and Space - the POTS. By systematically examining each dimension, product teams can uncover hidden needs, mitigate risks early, and design for long-term stability and competitiveness. This framework was successfully applied in Blue Aspirations during product development and also project execution.
Why Four Dimensions?
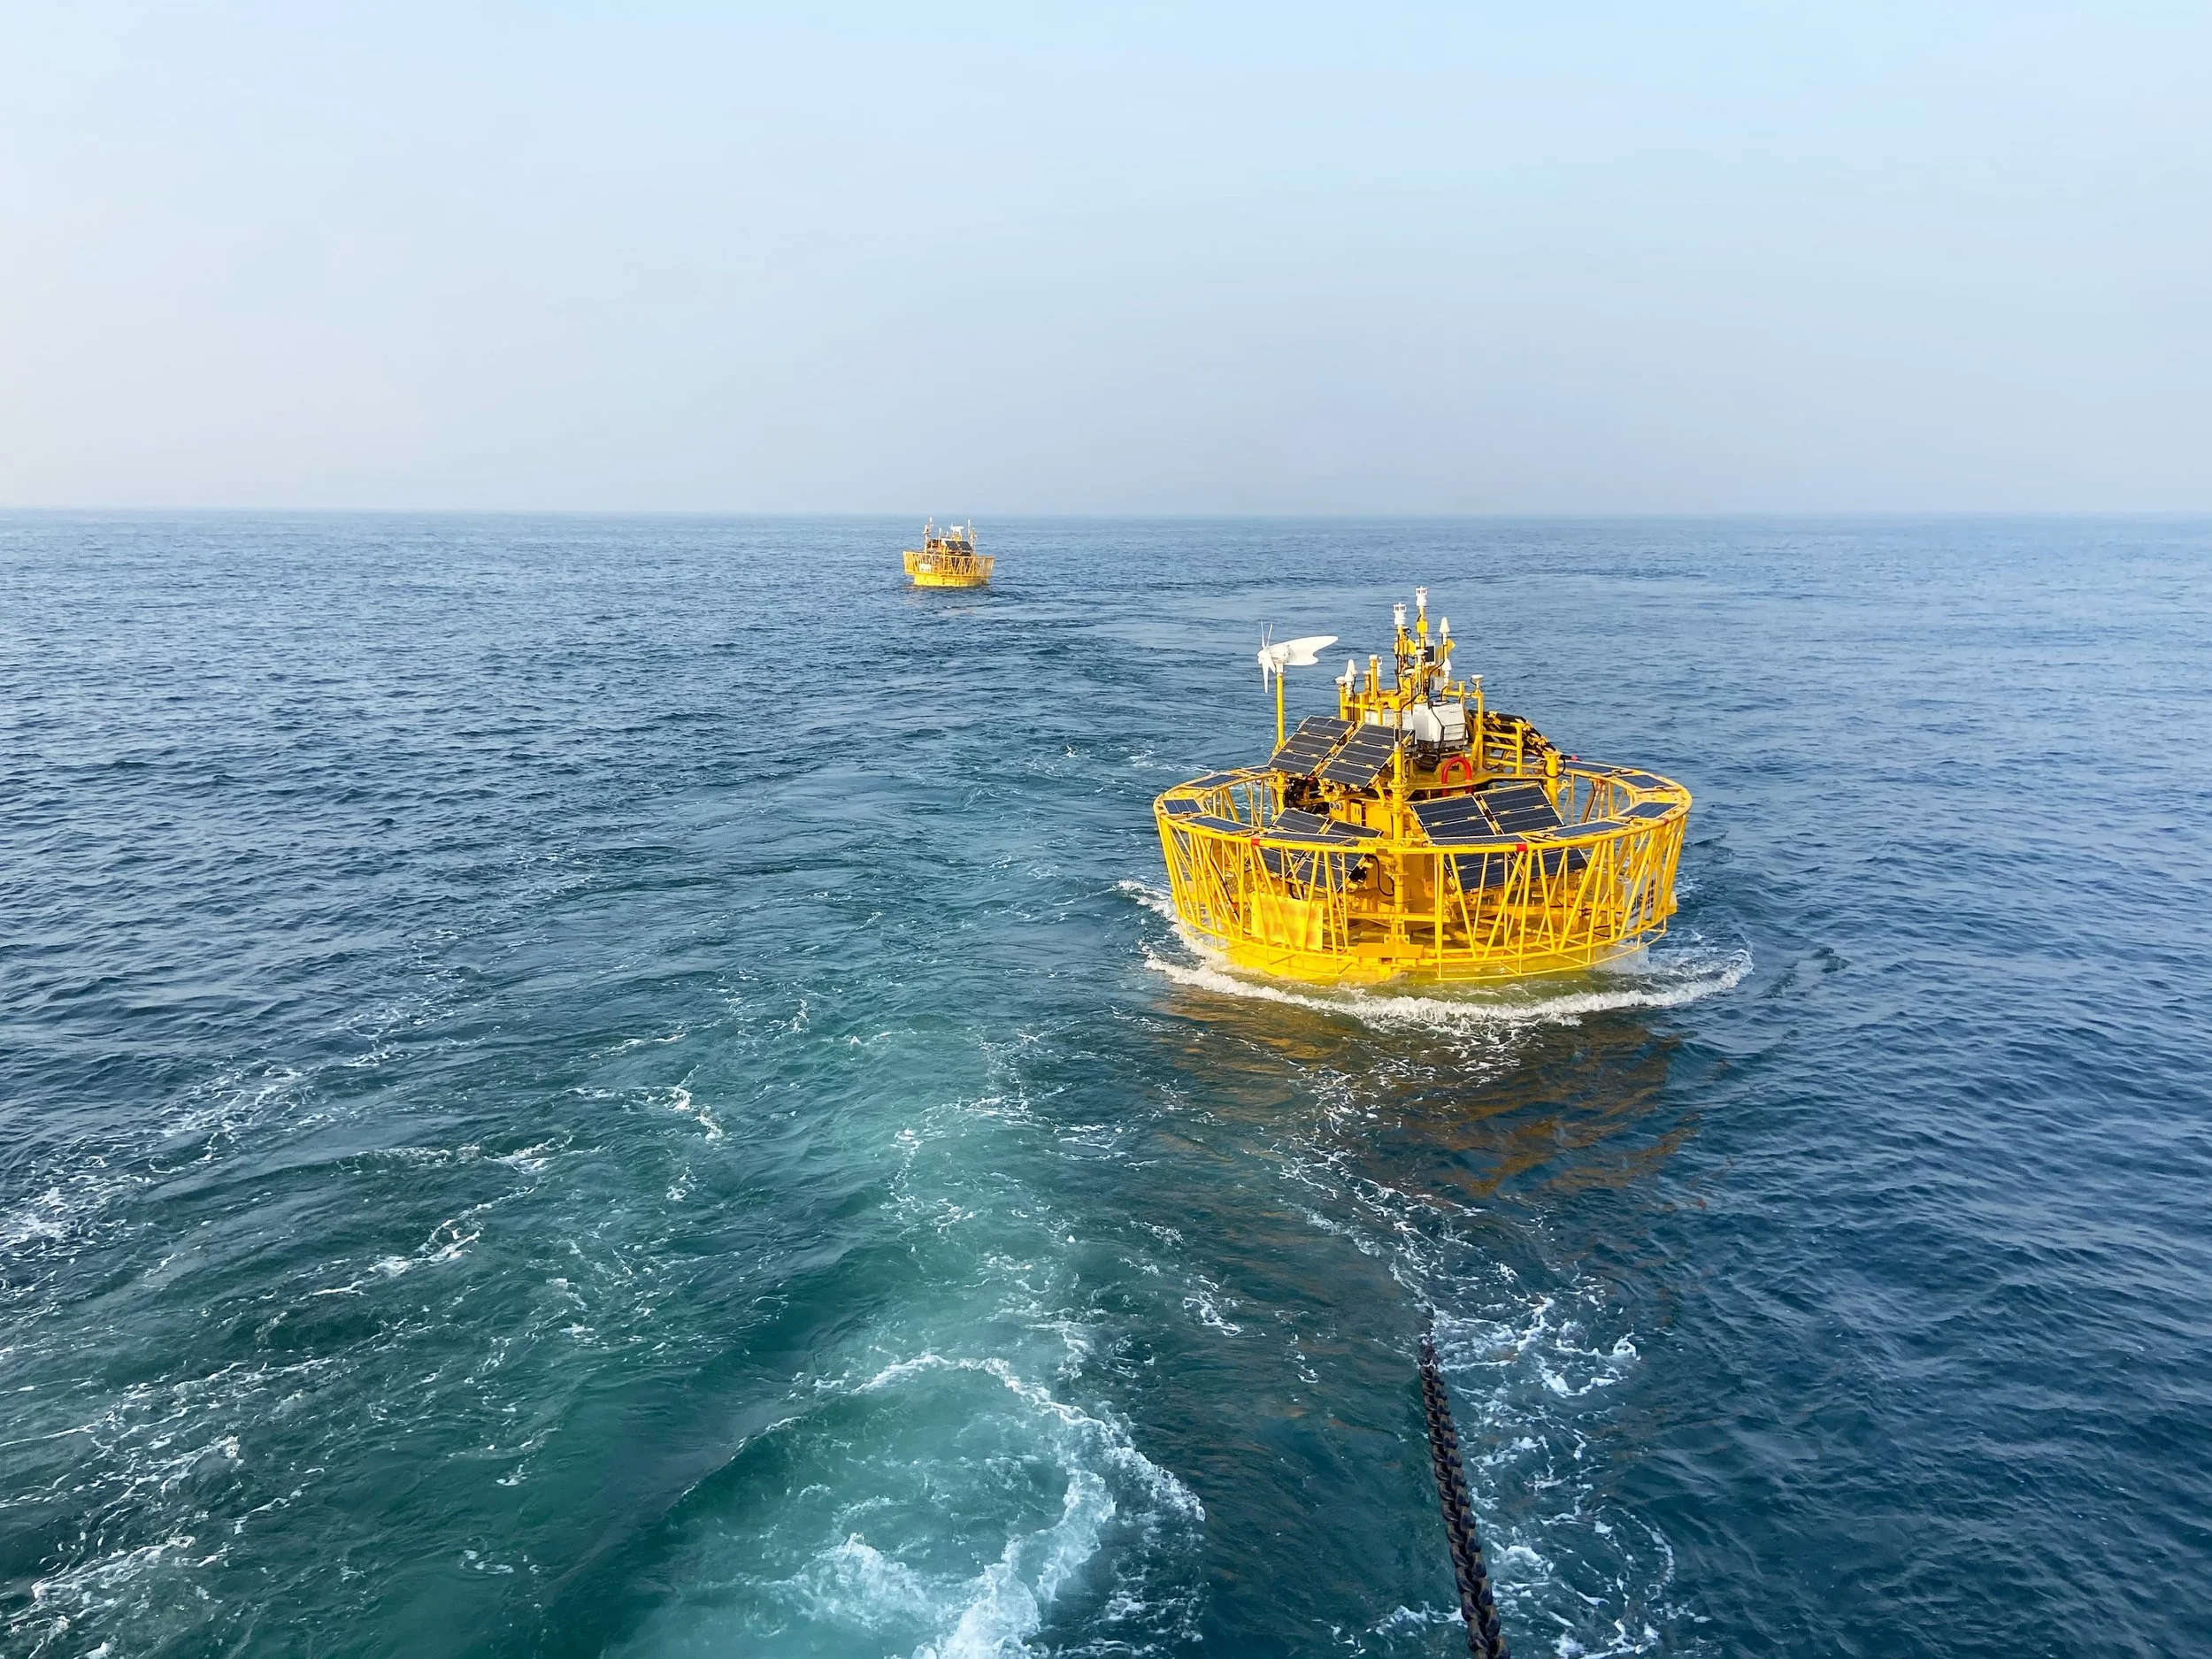
Products do not exist in isolation. They are used by people, interact with physical or digital objects, operate across time (from first use to end-of-life), and function within specific spatial contexts (from a buoy floating in the North Sea to a data center on shore). These four dimensions collectively define the product’s operational reality. Missing any one of them leads to blind spots. Below, we explore each dimension in detail using Floating LiDAR systems for offshore wind as a running example – a product that must survive harsh marine environments, serve stakeholders, and deliver bankable data.
1. People – The Human Actors
Every product serves one or more human roles. The “people” dimension includes not only end users but also installers, maintainers, administrators, bystanders, and even those who dispose of the product. Each role has unique needs, pain points, and risk profiles.
Key questions for analysis:
- Who are all the people who will touch, see, or be affected by the product?
- What are their goals, skills, physical capabilities, and emotional states?
- How do different user groups interact with each other through the product?
Floating LiDAR example:
A floating LiDAR buoy is deployed 40 nm offshore. The obvious “user” is the wind resource analyst who downloads and validates the data. But consider others: the marine technician who assembles the buoy at a port – they need one-handed fasteners and clear labeling in low light. The tow captain who moves the buoy to site – they need a visible towing eye and an AIS beacon that doesn’t interfere with navigation. The HSE inspector who checks compliance – they need accessible management process control policy and records. The developer will want bankable data to be delivered in time. And finally, the project team who retrieves the buoy after the project– they need clear instructions for disconnecting mooring lines and disposing of wastes.
Designing only for the wind analyst would ignore maintenance and safety risks, leading to field failures, crew injuries, or lost data.
Risk identification:
- Safety risks (crew climbing onto a slick, moving buoy)
- Usability risks (errors due to thick gloves or seasickness)
- Compliance risks (marine traffic regulations, data quality standards)
Competitive advantage:
Floating LiDAR systems that is analyzed and implemented with better thinking of different user roles will have higher chance to satisfy customers because developers desire higher uptime and lower bankability risks.
2. Objects – The Tangible and Intangible Artifacts
The “objects” dimension covers everything the product interacts with: other devices, components, data streams, tools, packaging, and even other products in the ecosystem. In the digital realm, objects include APIs, databases, and third-party services too.
Key questions:
- What physical or digital objects must the product connect to, depend on, or replace?
- What are the failure modes of those objects (e.g., battery degradation, biofouling, satellite signal loss)?
- How do objects age, wear, or become obsolete?
Floating LiDAR example:
A floating LiDAR buoy interacts with a long list of objects. Physically: the mooring chain and anchor (subject to abrasion and marine growth), the batteries (lithium or lead-acid, with finite charge cycles), the LiDAR sensor itself (laser windows that get salt spray), the GPS antenna (must see satellites through motion), and the onboard data logger. Digitally: the telemetry link (Iridium or cellular, with variable latency), the onshore server. Even the shipping container for transport is an object which may affect project execution.
If the design ignores how mooring chains wear over time (object aging), the buoy could drift off station – losing an entire month of data. If biological growth is ignored for the ADCP sensors, the met-ocean data delivery will suffer.
Risk identification:
- Dependency risks (single point of failure – e.g., one satellite link)
- Interoperability risks (new firmware on the GPS receiver breaks NMEA parsing)
- Supply chain risks (battery cells become long lead time)
Competitive advantage:
By analyzing object interactions early, you can design for modular replacement, open data protocols (so any onshore server can ingest the stream), and compatibility with standard offshore mooring components. Systems that “play well” with existing marine hardware reduce friction and spares cost for operators.
3. Time – The Full Lifecycle
Time is often neglected. Products work on day one but fail on day 365. Worse, time brings new People, new Objects, and even changes to Space.
Floating LiDAR example – aging and ecosystem shifts:
A buoy deployed for 2 years doesn't just wear out. Its whole context changes.
- Month 0: Commissioning engineers, new batteries, clean sensors.
- Month 6: Biofouling(new object) may affects ADCP data already.
- Month 12: The GPS receiver may fail and needs to be replaced – but the new unit has a different data format with a new version of firmware(new object), breaking the logger.
- Month 16: The 4G modem is sunset by the carrier. A satellite terminal is retrofitted (new object).
- Month 24: The buoy is retrieved and to be used for a new customer (new person). Old firmware needs to be updated. Battery is hazardous waste; the buoy hull may need painting fix.
Key aging risks:
biofouling downgrades met-ocean data, sensor drift corrupting wind data, expired TLS certificates stopping data uploads.
Competitive advantage:
Design for predictive aging, modular replacement, and remote updates. Developers pay for >95% data availability for 2 years, not 99% over 3 months.
4. Space – The Physical and Contextual Environment
Space encompasses where the product is used, stored, transported, and discarded. It includes macro factors (country, climate, water salinity, regulatory zone) and micro factors (deck layout of a service vessel, mounting orientation on a buoy). Space also covers virtual spaces (e.g., cloud regions, network coverage at sea).
Key questions:
- In which geographical and cultural spaces will the product operate?
- What are the environmental extremes: wave height, icing, lightning frequency, marine growth rate?
- How does the product’s location affect legal requirements (e.g., offshore renewable energy licenses, vessel traffic separation schemes)?
Floating LiDAR example:
A floating LiDAR buoy deployed off the coast of Scotland faces very different conditions than one in the South China Sea. In the North Sea: low temperatures, frequent gales, high salinity, and long nights in winter (solar charging is minimal). In Southeast Asia: high humidity, rapid biofouling, tropical storms, and heavy vessel traffic. Even within one site, micro-spaces matter: the LiDAR sensor on top of the buoy sees more motion than the IMU mounted near the waterline. The telemetry antenna must have a clear line of sight to the sky – if a radar reflector (another object) is mounted too close, it may create interference.
Also regulatory space: offshore wind sites often lie in exclusive economic zones (EEZs) with different rules for metocean equipment. Some countries require real-time position reporting; others restrict radio frequencies used by the telemetry link. And the physical space of the service vessel.
Risk identification:
- Environmental risks (icing adds weight and topples the buoy; lightning fries electronics)
- Regulatory risks (local certification for marine navigation lights, data privacy laws for telemetry)
- Logistics risks (transport from factory to port – road bridges, container dimensions)
Competitive advantage:
Products that adapt to multiple spaces – through dual-frequency radios, anti-fouling coatings suited to local biology, and adjustable mooring configurations – can serve global offshore wind markets without costly redesigns. Even for a single project, understanding the exact spatial context (e.g., a site near a shipping lane vs. a site near a seabird sanctuary) enables tailored features to the system.
Putting It All Together: A Practical Workflow
Using the POTS (People, Objects, Time, Space) framework, product teams for floating LiDAR (or any offshore wind asset) can run a structured analysis workshop:
1. Brainstorm across each dimension – Use a whiteboard. For “People”: survey technicians, data analysts, port authorities, decommissioning crews. For “Time”: unboxing, tow-out, storm season, decommissioning.
2. Map interactions – Draw connections. “Space (high biofouling zone)” + “Time (six months)” causes “Object (laser window)” to become occluded – which affects “People (maintenance crew)” who now must arrange maintenance activities.
3. Identify needs and risks – For each intersection, ask: “What requirement is implied?” (e.g., automatic cleaning wiper or sacrificial window film) and “What could go wrong?” (wiper motor jams due to salt crystals).
4. Prioritize and design – Translate insights into requirements: a corrosion-proof material, remote alert for data downgrading, and a service interval based on local fouling rates.
5. Validate across the lifecycle – Create test cases that simulate combinations: e.g., “a technician (People) in freezing and windy weather (Space) at 9 AM (Time) trying to replace a battery (Object) at the port(Space).”
Conclusion
The People-Objects-Time-Space framework transforms product analysis from a feature-centric exercise into a systemic exploration of the product’s entire existence. For a floating LiDAR system in offshore wind, this means moving beyond “wind speed accuracy” to asking: who touches the buoy, what fails at sea, when does the battery die, and where is the site really? By systematically answering these questions, teams uncover hidden requirements and preempt risks that would otherwise emerge after deployment – losing months of data or millions in financing. This holistic approach does more than avoid failures; it builds products that are robust, adaptable, and genuinely valuable across all contexts. In offshore wind, where reliability directly translates to bankability, mastering the four dimensions is not an option – it could be a necessity.